
Financial & GL Reporting Automation
Automate the financial and GL reports your organization produces every month-end, quarter-end, and year-end — balance sheets, income statements, cash flow statements, trial balances, and budget vs actual reports — built on SSRS, Power BI, SQL Server, and Crystal Reports.
ReportingGuru builds custom financial and GL reporting systems for private equity firms, fund administrators, real estate funds, multi-entity businesses, and accounting teams. We automate the reporting workflows that consume your close cycle — generating financial statements from validated GL data, consolidating multi-entity financials without manual spreadsheet assembly, producing budget variance reports the day the close completes, and delivering financial packages to boards, lenders, investors, and management teams on schedule every period.
We connect directly to your ERP or accounting system — SAP, Oracle, Microsoft Dynamics,
NetSuite, QuickBooks Enterprise, Sage Intacct, Investran, Geneva, or any SQL-accessible data source — and build the reporting infrastructure that turns your GL data into accurate, consistently formatted, audit-ready financial reports. We do not sell software. We build the custom reporting layer that makes your existing systems produce the financial deliverables your stakeholders expect.
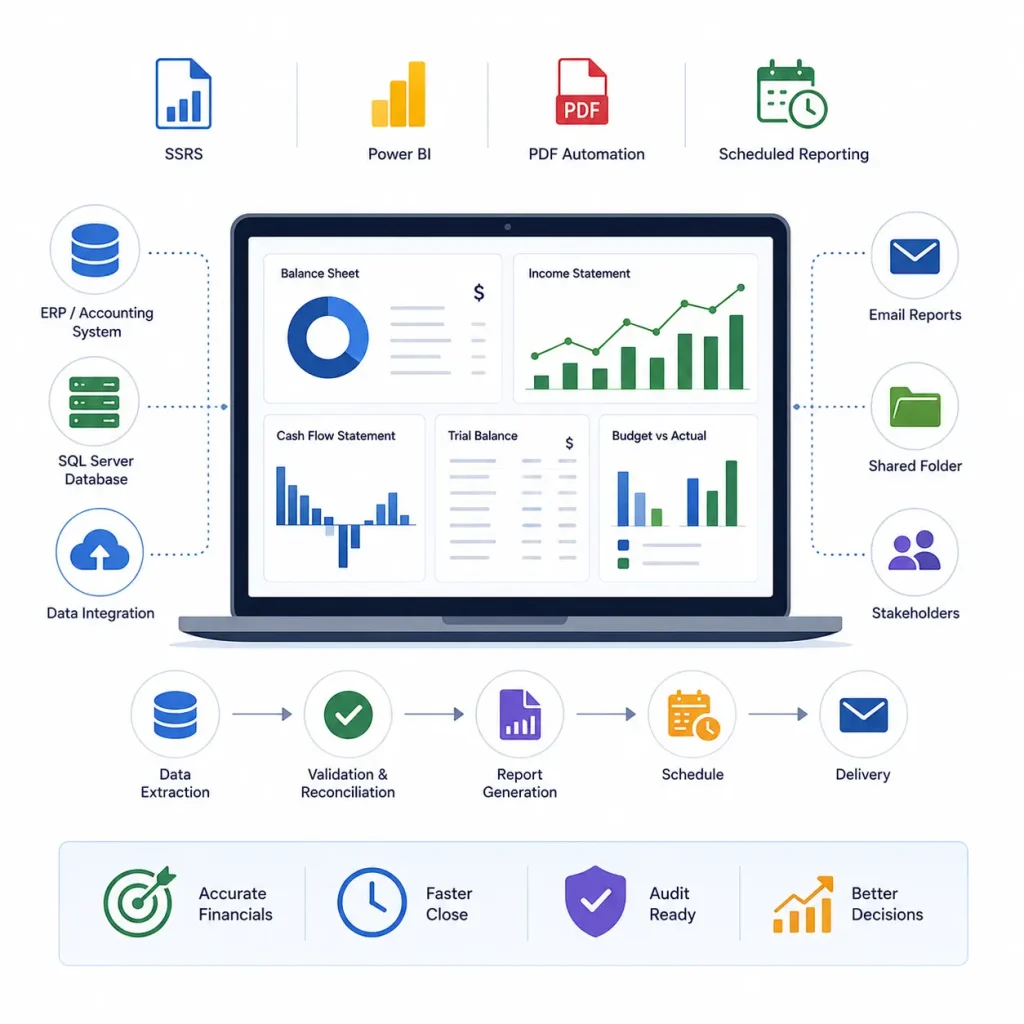
The Complete Financial Reporting Workflow — Automated
Every month-end and quarter-end, finance teams and fund administrators face the same pressure: close the books, validate the trial balance, reconcile every account, generate financial statements, produce management variance reports, and deliver financial packages to boards, lenders, investors, and regulatory bodies — accurately, on time, and in a format that serves each audience’s specific needs.
Manual financial reporting — stitching together data from the accounting system, reformatting in Excel, updating formula-driven financial statement templates, and assembling board packages document by document — is slow, error-prone, and does not scale. As entity count grows, as reporting audiences multiply, and as close deadlines compress, manually managed financial reporting processes become the bottleneck that limits your organization’s ability to operate with speed and confidence.
ReportingGuru builds the reporting infrastructure that eliminates this bottleneck. We connect directly to your GL data, build parameterized financial report templates on SSRS, Power BI, Crystal Reports, or Excel, and create automated delivery pipelines that produce every financial report — for every entity, every audience, every period — the moment the close is complete.
Our financial and GL reporting solutions serve two distinct but connected environments:
- Operating Company Financial Reporting — balance sheets, income statements, statements of cash flows, trial balances, and budget vs actual reports for multi-entity businesses, holding companies, franchise groups, and portfolio companies. Multi-entity consolidation, intercompany elimination, foreign currency translation, departmental P&L reporting, and lender covenant compliance — all automated from a centralized SQL Server data model.
- Fund and Investment Entity Financial Reporting — GAAP-compliant fund financial statements under ASC 946, ASC 820 fair value disclosures, partners’ capital schedules, statements of operations for investment companies, and fund-level KPI dashboards — delivered as audited annual packages and quarterly unaudited reports for LP investors. Fully integrated with the investor reporting and capital account workflows that drive LP communications.
Need Help Automating Your Financial Reporting Workflow?
ReportingGuru replaces manual financial reporting processes with automated, scheduled, datadriven systems built on the reporting platforms your team already uses. Whether you need to produce a single GAAP-compliant balance sheet or deliver consolidated financial packages to a board, a set of lenders, and 200 LP investors simultaneously — we build the reporting infrastructure that handles the complexity, maintains the accuracy, and meets every deadline. We help finance and fund reporting teams:
- Automate balance sheet, income statement, and cash flow statement generation at every close
- Consolidate multi-entity financials with intercompany elimination and currency translation
- Replace manual Excel financial statement templates with scheduled SSRS or Power BI reports
- Produce trial balance reports with exception detection and reconciliation status integration
- Automate budget vs actual variance reports delivered to department heads the day close completes
Tell Us About Your Financial Reporting Workflow
Financial & GL Reporting Workflows We Automate
Each report type below has its own dedicated page covering what the report is, why organizations use it, common KPIs and calculations, reporting challenges, automation options, and delivery methods — for both operating company and fund reporting environments.
Balance Sheet
Automate point-in-time financial position reporting — assets, liabilities, and equity or partners' capital — for single entities and multi-entity consolidated groups, with intercompany elimination, foreign currency translation, and ASC 820 fair value disclosures for investment company structures.
Income Statement / Profit & Loss
Automate revenue, expense, and profitability reporting — from high-level executive summaries to detailed departmental P&Ls with cost allocation — covering both ASC 946 fund statements of operations and operating company income statements with EBITDA, margin analysis, and budget variance integration.
Statement of Cash Flows
Automate indirect method cash flow statement generation — operating, investing, and financing activities — with automated working capital change derivation, balance sheet cash reconciliation validation, noncash supplemental disclosures, and multi-entity consolidation with foreign currency translation
Trial Balance
Automate GL trial balance extraction, validation, and exception detection — unadjusted, adjusted, and post-closing views — with multi-entity account mapping, intercompany balance monitoring, reconciliation status integration, and close management checkpoint reporting at every stage of the close cycle.
Budget vs Actual
Automate budget variance reporting — departmental P&L actuals vs. budget, fund expense actuals vs. disclosed budget, and portfolio company operating performance vs. acquisition underwriting — with multi-version budget management, rolling forecast integration, and scheduled delivery to boards and department heads the day close completes.
Common Parameters Across Every Financial Report
Every financial and GL reporting solution we build is fully parameterized — so finance teams, fund administrators, boards, lenders, and auditors see exactly the data they need, for exactly the entity and period they are reporting on.
Entity / Legal Entity
Reporting Period
As-Of Date
Comparative Period
Consolidation Level
FX Translation
Cost Center Budget
Version
Reporting Period
Detail Level
Audit Status
Revenue Stream
Built For Complex Financial Reporting Operations
Financial and GL reporting is more than generating statements. Finance teams must manage close deadlines across multiple entities, validate every trial balance account, eliminate intercompany balances, reconcile foreign currency translations,
produce budget variance reports under deadline pressure, and deliver financial packages to multiple audiences — boards, lenders, auditors, investors, and regulators — accurately and on time, every period.
Operational Challenges
- Month-end and quarter-end close deadlines across multiple legal entities
- Manual Excel-based financial statement consolidation across 5, 10, or 50+ entities
- Intercompany balance reconciliation and elimination before consolidated statements
- Foreign currency translation adjustments across multi-currency entity structures
- Trial balance exception detection and account reconciliation backlog management
- Producing budget vs actual variance reports manually after every close
- Delivering financial packages to boards, lenders, investors, and regulators on different schedules
- Fair value measurement and ASC 820 / IFRS 13 disclosure preparation for investment companies
- Coordinating fund financial statement production with annual audit timelines
- Generating departmental P&L reports with shared cost allocations for 20+ cost centers
- Lender covenant calculation and compliance certificate delivery on monthly or quarterly schedules
- Managing multiple budget versions — original budget, reforecasts, rolling forecasts — simultaneously
ReportingGuru Solutions
- Automated financial statement generation from validated GL data at every close
- Multi-entity consolidation engines with intercompany elimination and currency translation
- Centralized SQL Server GL data models connected directly to your ERP or accounting system
- SSRS-based balance sheet, income statement, and cash flow statement automation
- Power BI financial dashboards for boards, management teams, and executive reporting
- Trial balance automation with exception detection and reconciliation status integration
- Budget vs actual reporting delivered to boards and department heads the day close completes
- GAAP-compliant fund financial statement packages for LP annual audit delivery
- ASC 946 and ASC 820 financial statement template development and automation
- Multi-version budget management with planning tool ETL integration (Adaptive Insights, Anaplan, Vena)
- Lender covenant calculation automation and compliance certificate generation
- Crystal Reports modernization — upgrade legacy financial statement templates to SSRS or Power BI
Built On The Platforms Your Team Already Uses
ReportingGuru builds financial and GL reporting workflows on the reporting platforms and accounting systems your team already relies on. We connect directly to SAP, Oracle, Microsoft Dynamics, NetSuite, QuickBooks Enterprise, Sage Intacct, and fund-specific platforms including
Investran (eFront), Allvue, Geneva, and Yardi Investment Management — extracting GL data, applying consolidation and calculation logic, and delivering automated financial reports through SSRS, Power BI, Crystal Reports, and Excel.
We do not require you to migrate to a new ERP or replace your accounting system. We build the custom reporting infrastructure — GL data pipelines, consolidation engines, financial statement templates, and delivery automation — that makes your existing systems produce the financial reports your boards, lenders, auditors, and investors require.

SQL Server Reporting Services (SSRS)

Crystal Reports

Custom Report

BIRT
Power BI
Reporting Software and Architecture
Frequently Asked Questions
Can ReportingGuru automate financial statement production across multiple entities?
Yes. Multi-entity financial statement consolidation is one of our most common engagements. We build SQL Server consolidation engines that aggregate entity-level trial balances, apply intercompany elimination rules, handle foreign currency translation, and produce both entitylevel and consolidated balance sheets, income statements, and cash flow statements automatically at every close — replacing manual spreadsheet consolidation.
Which ERP and accounting systems can ReportingGuru connect to?
We connect to SAP, Oracle, Microsoft Dynamics (365 and GP), NetSuite, QuickBooks Enterprise, Sage Intacct, and fund-specific platforms including Investran (eFront), Allvue, Geneva (SS&C), Yardi Investment Management, and Juniper Square — typically via direct SQL database access, ODBC connection, API, or structured data export. If your accounting system stores data in a SQL-accessible format, we can connect to it.
Can financial statements be automated on SSRS, Power BI, and Excel simultaneously?
Yes. We build financial reporting from a centralized SQL Server data model — so the same validated GL data can drive an SSRS-formatted balance sheet for audit delivery, a Power BI dashboard for board reporting, and an Excel workbook for management review. Each output format is a separate template driven by the same underlying data, ensuring consistency across all audiences without maintaining separate data sources.
Can budget vs actual reports be delivered automatically the day the close completes?
Yes. We build budget vs actual reporting pipelines that monitor the close status in your accounting system and trigger report generation automatically when the period is marked as closed. Boardlevel summary reports, departmental variance reports, and lender covenant calculations are all generated and distributed in the minutes after close completion — not the days after.
How does ReportingGuru handle intercompany elimination in consolidated financials?
We build intercompany elimination rule tables in SQL Server that define the elimination entries required for each intercompany relationship — subsidiary investment vs. equity, intercompany receivable vs. payable, intercompany revenue vs. cost of sales. These rules are applied automatically during the consolidation process at each close. Elimination detail is preserved in the data model and available for audit review and management investigation.
Can financial reports be produced for fund entities under ASC 946 investment company accounting?
Yes. We build financial statement templates specifically structured for investment company presentation under ASC 946 — including the statement of assets and liabilities, statement of operations (with investment income, realized and unrealized gain components), statement of changes in partners’ capital, and ASC 820 fair value level disclosures. These templates comply with GAAP investment company presentation requirements and are designed to support annual audit delivery to LP investors.
Can trial balance reports include exception detection and account reconciliation status?
Yes. We build exception detection rule engines that flag accounts with unusual activity — large postings against expected normal balance, accounts with intercompany balances that do not agree between entities, and accounts that have not been reconciled within the required period. Reconciliation status data is integrated into the trial balance report so the finance team sees both the GL balance and the reconciliation coverage in a single view.
Can financial reports be delivered to different audiences in different formats?
Yes. We build multi-audience financial report delivery from the same SQL Server data model — a detailed GAAP-compliant financial statement for audit, a five-line executive summary for the board, a lender compliance format showing covenant ratios, and a department-level P&L for operational managers. Each format is a separate SSRS or Power BI template driven by the same validated data, generated and distributed automatically to the appropriate audience at each close.
How long does it take to build an automated financial reporting system?
Timeline depends on entity count, consolidation complexity, and the existing technology stack. A singleentity SSRS financial statement suite connected to an ERP typically takes 4–8 weeks. A multientity consolidation system with currency translation, budget vs actual integration, and Power BI dashboards may take 12–20 weeks. Fund financial statement systems for ASC 946 investment companies typically take 8–14 weeks depending on waterfall and capital account complexity.
Can ReportingGuru modernize our legacy Crystal Reports financial statement templates?
Yes. Crystal Reports modernization is a common engagement — particularly for organizations running legacy ERP systems with financial statement packages built on older Crystal Reports versions. We assess the existing templates, map the data sources, rebuild the report logic in SSRS or Power BI, add new features such as comparative periods, budget variance columns, and exception flagging, and migrate delivery from manual Crystal Reports execution to automated scheduled reporting.